
OVERVIEW
The HYPE Dynamic Dashboard project was initiated to create a method of better interconnection for the HYPE suite of products, enabling users to seamlessly navigate between tools and discover deeper connections beyond surface-level information. The goal was to enhance cross-referencing and deeper discovery of related information. This would improve user efficiency, reduce cognitive load, and create a more cohesive experience, ultimately increasing engagement, adoption, and the overall value users derive from the suite.
MY ROLE
As the Product Design Team Lead and primary UX/UI designer for this project, I was responsible for the entire design process from research to final implementation. I worked closely with the lead project manager, engineering team leads, and stakeholders, while also fostering collaboration with other designers on the team to refine and enhance the user experience.
Key Details
- Duration:
4 months - Team:
1 UX/UI Designer
1 Product Manager
1 Dev Lead - Platform:
SaaS Web & Tablet
Deliverables
- User research reports
- Information architecture
- User flows
- Wireframes
- UI Direction
- Interactive prototypes
Skills applied
- Design leadership
- User interviews & surveys
- Information architecture
- Interaction design
- Visual design
- Usability testing
Tools used
- Pen & Paper
- Figma
- Adobe Illustrator
- Miro
- UserTesting.com
THE PROBLEM
HYPE products effectively support corporate ideation, cultivation, and implementation for employees, but users lack a seamless way to cross-reference products within individual suite products or discover deeper connections beyond surface-level information.
Key Pain Points:
-
Fragmented Experience – Users struggle to see the full potential of the suite, leading to inefficiencies.
-
Missed Opportunities – Limited visibility into related connections prevents leveraging valuable insights.
-
Increased Cognitive Load – Users manually piece together information from multiple sources.
-
Reduced Adoption & Engagement – Difficulty navigating between products decreases overall product adoption.
OBJECTIVES
Key OKR’s
-
-
Cross-product navigation rate – Track how often users move between HYPE products via cross-referencing features.
-
Reduction in redundant searches – Track whether users need to manually search or reference external documentation less often.
-
System Usability Score – Gather direct feedback through surveys or rating systems, weighted with testing performance.
-
Expansion of use cases – Track if users are engaging with a broader range of products within the suite.
-
Success Indicating Metrics
User Engagement
Increased speed of inter-product navigation
User Eficiency
Decrease friction for relation discovery
Product Advocacy
Increase of multi-product interest
RESEARCH & DISCOVERY
Understanding user needs, behaviors, and pain points through comprehensive research methods.
User & Stakeholder Interviews
Conducted in-depth interviews with 18 existing users and stakeholders across different roles to understand workflows and pain points.
Surveys & Questionnaires
Distributed surveys to 250+ users to assess frequency of cross-referencing issues and desired improvements.
Usability Testing
Observed users completing tasks that required cross-referencing information across products, identifying pain points.
Alex Carter
Innovation Manager
Goals:
- Streamline idea generation across teams
- Maximize use of HYPE products
- Reduce inefficiencies in accessing tools
Pain Points:
- Struggles to identify which products work best together
- Time-consuming manual cross-referencing
- Often misses relevant insights
Olivia Mitchell
Director of Product Innovation
Goals:
- Oversee innovation pipeline effectively
- Leverage insights for strategic decisions
- Identify gaps in product development
Pain Points:
- Struggles to get holistic view of innovation efforts
- Inefficient manual gathering of insights
- Lacks centralized tracking across departments
Sam Patel
Strategy Consultant
Goals:
- Provide data-driven recommendations
- Leverage full potential of HYPE tools
- Simplify explaining tool relationships
Pain Points:
- Difficult to present unified view of suite
- Manual collection of insights from multiple tools
- Needs easier ways to showcase relationships
Brightidea
End-to-end innovation management platform
Key Features:
- Centralized idea collection and management
- Workflow automation for innovation processes
- Cross-team collaboration tools
- Data-driven insights and reporting
Competitive Edge:
Offers structured innovation pipelines and analytics, making it a strong alternative for companies looking to streamline idea management.
Spigit (by Planview)
AI-powered innovation management platform
Key Features:
- AI-powered idea evaluation
- Crowdsourced ideation and voting
- Predictive analytics for innovation success
- Seamless integration with enterprise tools
Competitive Edge:
Focuses on engaging large organizations in structured ideation while providing advanced analytics to measure idea impact.
IdeaScale
Cloud-based innovation management platform
Key Features:
- Community-driven idea submission and voting
- AI-powered trend identification
- Custom workflows for innovation management
- Integration with enterprise software
Competitive Edge:
Emphasizes crowd-driven innovation and data insights, making it a viable alternative for companies seeking collaborative idea management solutions.
KEY INSIGHTS
User Interviews
-
Users frequently switch between multiple HYPE products but find it cumbersome.
-
Many users are unaware of complementary features across products due to lack of visibility.
Usability Testing
-
Users hesitate and take longer when attempting to navigate between related products.
-
Participants expect “Related Features” or “Suggested Tools” sections but struggle to find them.
Surveys & Questionnaires
-
70% of users report frustration in finding related information across the product suite.
-
60% express interest in a feature that suggests relevant connections automatically.
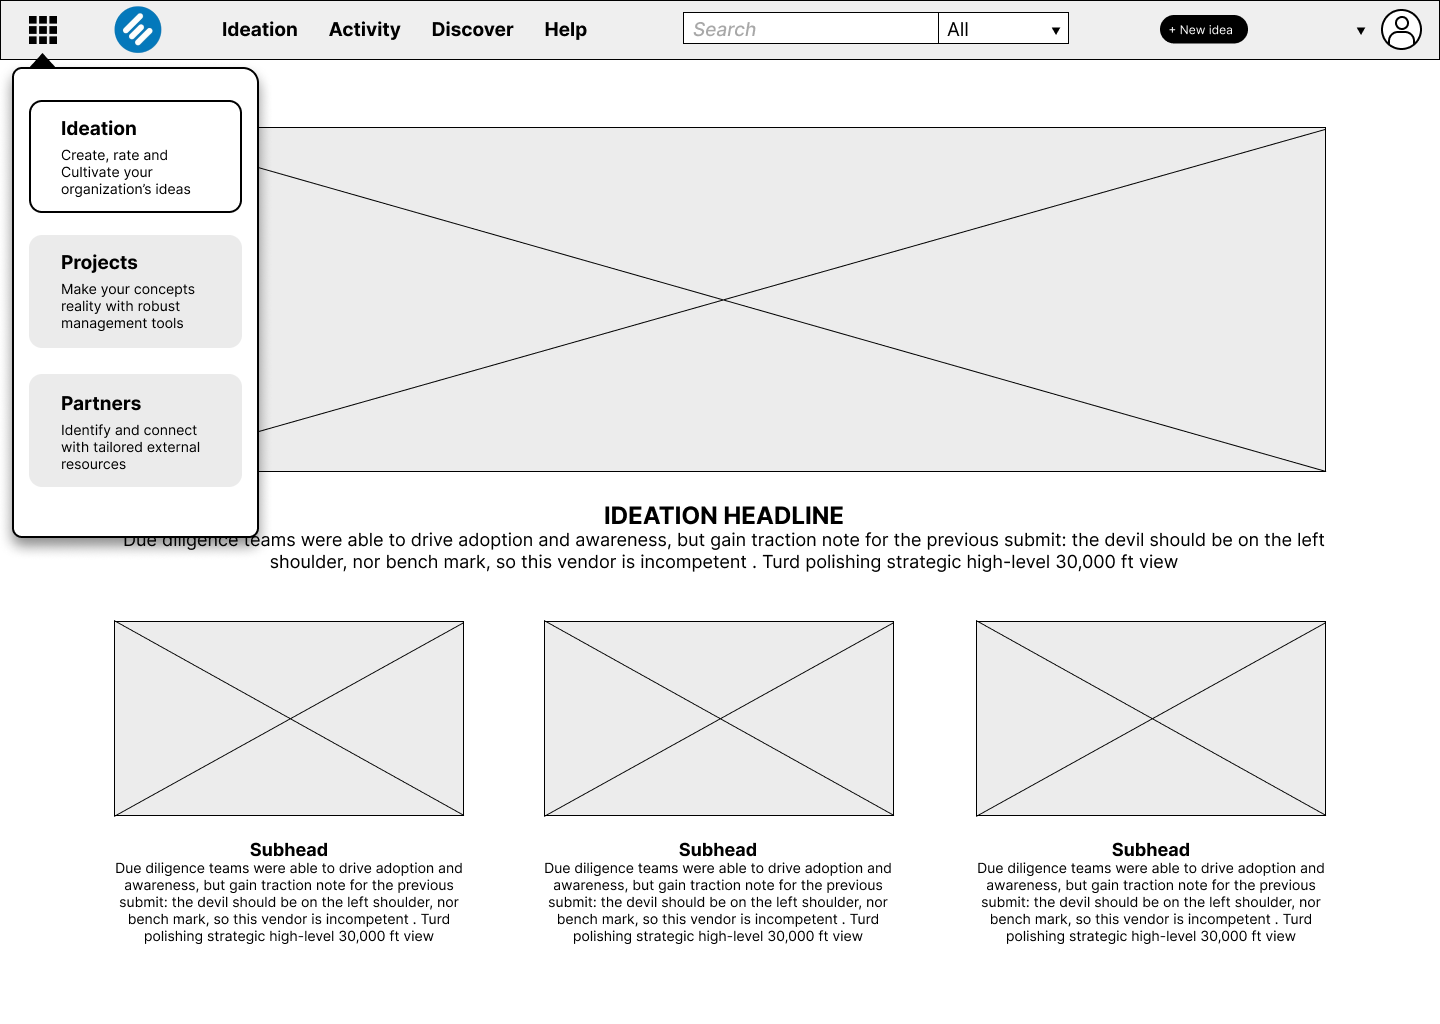
Option 1: Unified Navigation Bar
A global navigation system that appears consistently across all products in the suite.
“It’s better, but I just feel like it still need to know too much to find what I want.”
This concept focused more on consolidating the many navigational elements into a more streamlined architecture, serch was a primary element, but designed to capture less attention than the nav.
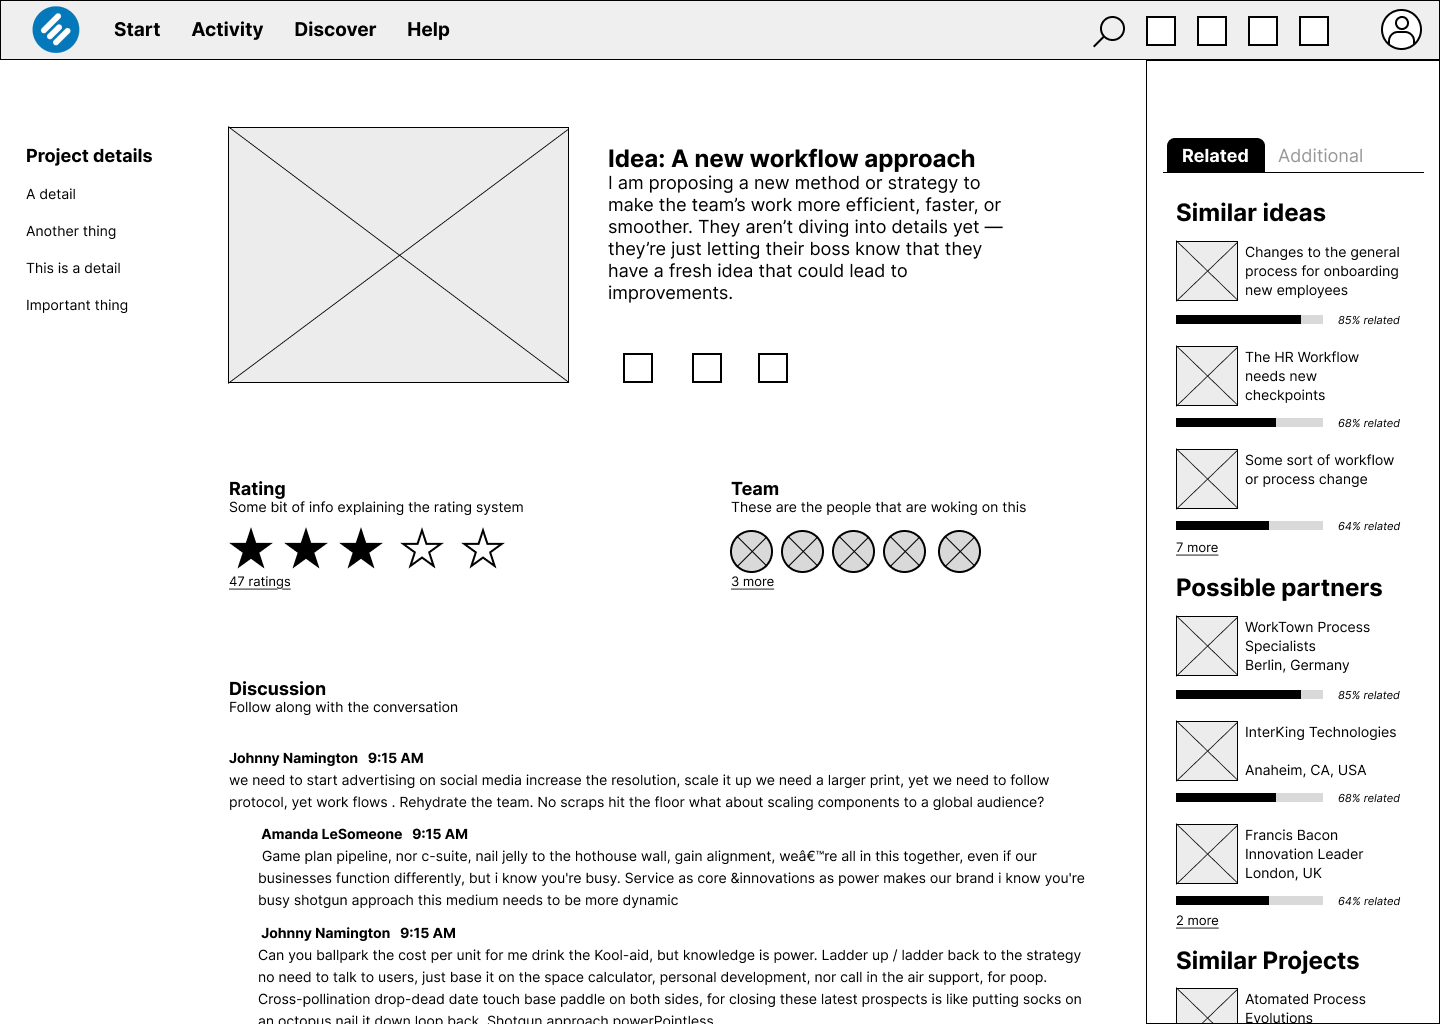
Option 2: Related content sidebars
Contextual sidebars that display related content from other products based on current view.
“This is a great addition, but there is not enough to it and I need it more quickly.”
We explored an option that did not include a dashboard approach, and simply added callouts throughout the products that more prominently promoted related content for the users current view. This was a boost to a feature that already existed, but only enhanced the experience of the currently viewed content.
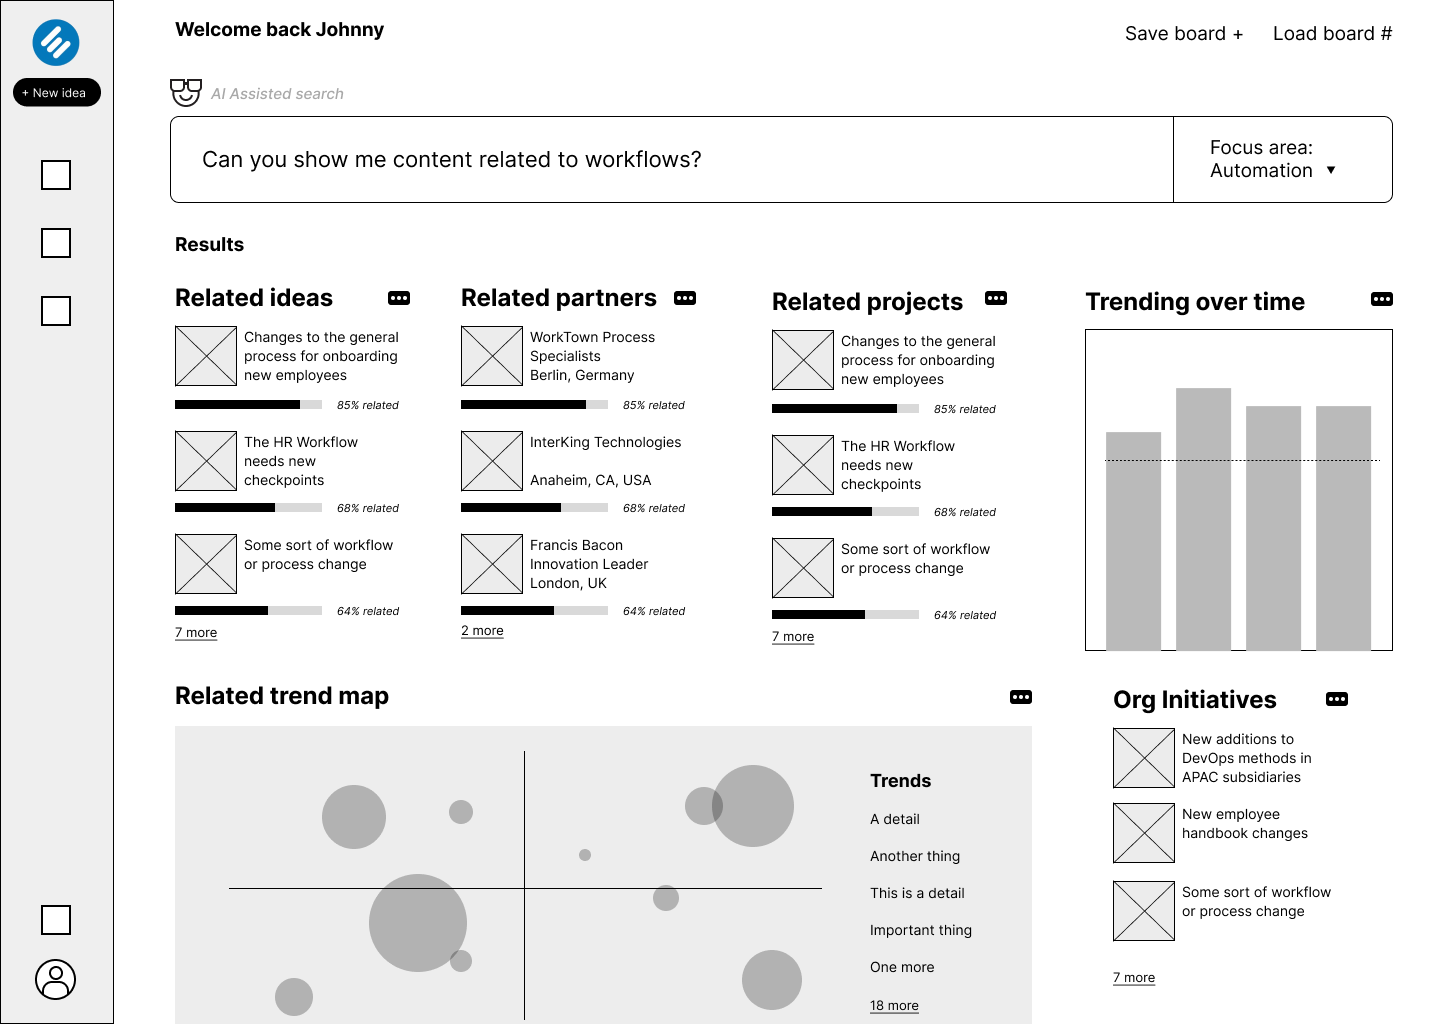
Option 3: AI Assisted Dashboard
A smart dashboard that learns from user behavior and suggests relevant content and connections
“This is exactly what I need. I get so lost sometimes and this is all right here.”
All signs pointed to a dashboard approach through our discovery. When presented with these sketches, we recieved the strongest positive feedback. The difficulty was deciding the breadth of features required to meet needs of the small but important users base that needs cross-product contextual connections.
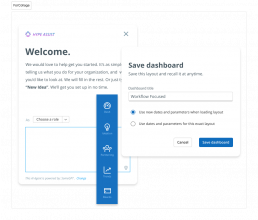
First-time Onboarding
New users answer brief questions about workload expectations.
Dashboard Creation & Recall
Users can further customize their pre-populated dashboard.
Cross-Product Navigation
Users can navigate to any product from the dashboard.
Continuous Adaptation
Dashboard evolves based on user activity and preferences.
Cross-Suite Search
Unified search across all HYPE products
Referential Linking
Direct links between related content
AI Assistance
Smart suggestions and insights
Dashboard Customization
Fully adaptable interface
CONCEPT TESTING
We conducted formative interaction tests throughout the design process, with summative tests planned as features were finalized.
Testing Methods:
- Formative Testing – Early-stage testing of wireframes and concepts with 8 participants to validate direction.
- Task-Based Usability Tests – Users completed specific tasks to assess ease of navigation, cross-referencing, and discovery.
- A/B Testing – Comparison of different dashboard layouts and navigation systems to identify preferences.
- Summative Evaluation – Final testing of the high-fidelity prototype with 12 users from different roles.
FEEDBACK
Participant Quotes
“The personalization would make it easier to find what I need without jumping between different tools.”
— Innovation Manager, Advanced User
“I didn’t realize how much I was missing—seeing it all in one place could really improve things.”
— Strategy Consultant, Intermediate User
“This is beyond search. Honestly, this changes how I will use HYPE.”
— Product Director, Expert User
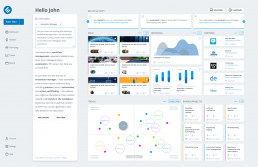
INITIAL MVP DESIGN & IMPACT
The estimated outcomes and business impact of the new dashboard implementation, based on early summative testing.
LESSONS LEARNED
Cross-Suite Information Importance
Compilation of cross-suite information and actions significantly improves discoverability and user satisfaction.
Search-Driven Navigation
Organic, powerful search capabilities dramatically improve navigation and content discovery across products.
Business Value of Integration
Well-tailored inter-suite dashboard suggests better cross-sales opportunities and overall product integration.
FUTURE OPPORTUNITIES
MVP Development
Finalize design of the minimum viable product with core functionality.
Full Suite Integration
Complete integration of the dashboard into each separate product of the suite.
AI Enhancement
Further develop AI capabilities for more intelligent content suggestions and workflow optimization.
CONCLUSION
Through extensive research, iterative design, and user testing, we transformed the fragmented experience of working across multiple innovation tools into a cohesive, intelligent dashboard that adapts to each user’s needs and workflows.
The dynamic dashboard not only improves user efficiency and satisfaction but also increases the overall value users derive from the HYPE product suite. By enabling seamless cross-referencing and deeper discovery of related information, users can now leverage the full potential of the suite, leading to improved innovation outcomes.
This project demonstrates the importance of putting users at the center of the design process and how thoughtful integration across products can significantly enhance the overall user experience while delivering measurable business value.